How AI Can Automatically Prepare Your Weekly Business Report (2026 Guide)
Discover how automated reporting uses AI to generate weekly business reports, track KPIs, save time, and improve decisions for small businesses.
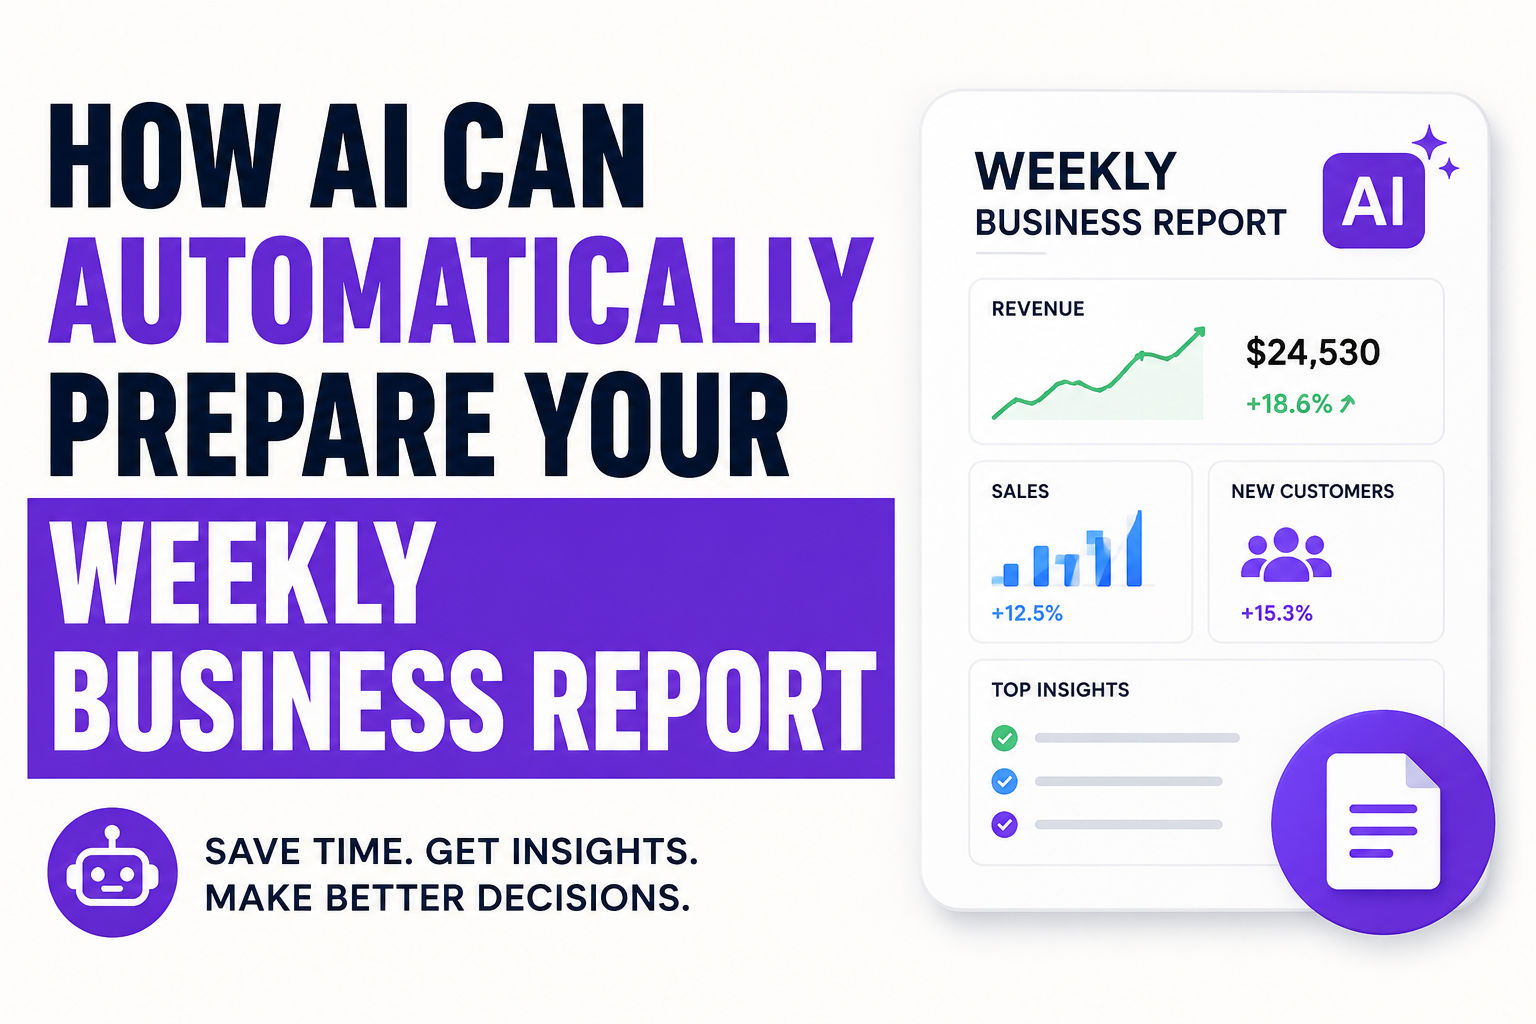
Introduction – Why Weekly Reporting Takes Too Much Time
It's 8:47 AM on Monday. You've just sat down with your coffee, ready to tackle the week ahead. Then you remember. The weekly report.
You sigh, open fifteen browser tabs, and start the ritual. Export from Google Ads. Export from GA4. Export from Salesforce. Copy. Paste. Copy. Paste. Try to remember why that one formula broke last week. Fix it. Break something else. Fix that too. Format. Reformat. Add colors. Remove colors. Wonder why the numbers don't match. Realize you forgot to update a date range. Start over.
Two hours later, you finally hit send. Your coffee is cold. Your morning is gone. And you'll do it all again in seven days.
I've been there. More times than I care to admit. And honestly? It drove me crazy. Not just because it was boring—though it definitely was—but because it felt so wasteful. I'm a business owner. My time should go toward growing my business, not wrestling with spreadsheets.
So I started looking for a better way. And what I found changed how I work entirely.
AI can handle this whole process for you. No more manual data entry. No more broken formulas. No more lost Monday mornings. Let me show you how this actually works, warts and all, and why I think it's one of the smartest investments you can make in your business operations.
Before we dive in, it's worth understanding the difference between AI agents vs AI assistants—because the technology behind automated reporting is more sophisticated than you might think.
1. Why Every Small Business Needs Weekly Business Reports
Before we get into the automation stuff, let's talk about why you should even care about weekly reports in the first place.
I know what you're thinking. "Reports are just busywork. My accountant handles the numbers. I'm too busy actually running my business."
I used to think the same thing. Then I almost ran out of cash because I wasn't paying attention.
The Cost of Not Looking
Here's the thing about running a business—things change fast. A client you counted on might bail. A marketing channel that was working might suddenly stop. Your costs might creep up without you noticing.
If you only look at your numbers once a quarter, you're basically driving with your eyes closed. You'll only realize something's wrong when you crash.
Monthly reporting is better, but it still leaves you with blind spots. A lot can happen in thirty days. Customers can churn. Cash can dry up. Opportunities can pass you by.
Weekly reporting gives you a fighting chance. You catch problems early while they're still fixable. You spot opportunities while they're still available. You make decisions based on what's actually happening, not what happened two months ago.
I'm not saying you need to obsess over every number. But checking the vital signs of your business once a week? That's just common sense.
What Actually Matters
This is where people go wrong. They try to track everything and end up tracking nothing effectively.
I've learned the hard way that less is more. A good weekly report should fit on one page. Maybe two if you're feeling fancy.
Here's what I actually care about in my weekly report:
- Revenue - Obvious, but I want to see the trend, not just the number
- New leads - Are we bringing in enough opportunities?
- Customer churn - Are people staying or leaving?
- Cash position - Because running out of money ruins your whole day
- Team performance against goals - Are we actually doing what we said we'd do?
That's it. Five things. Anything beyond that is probably noise.
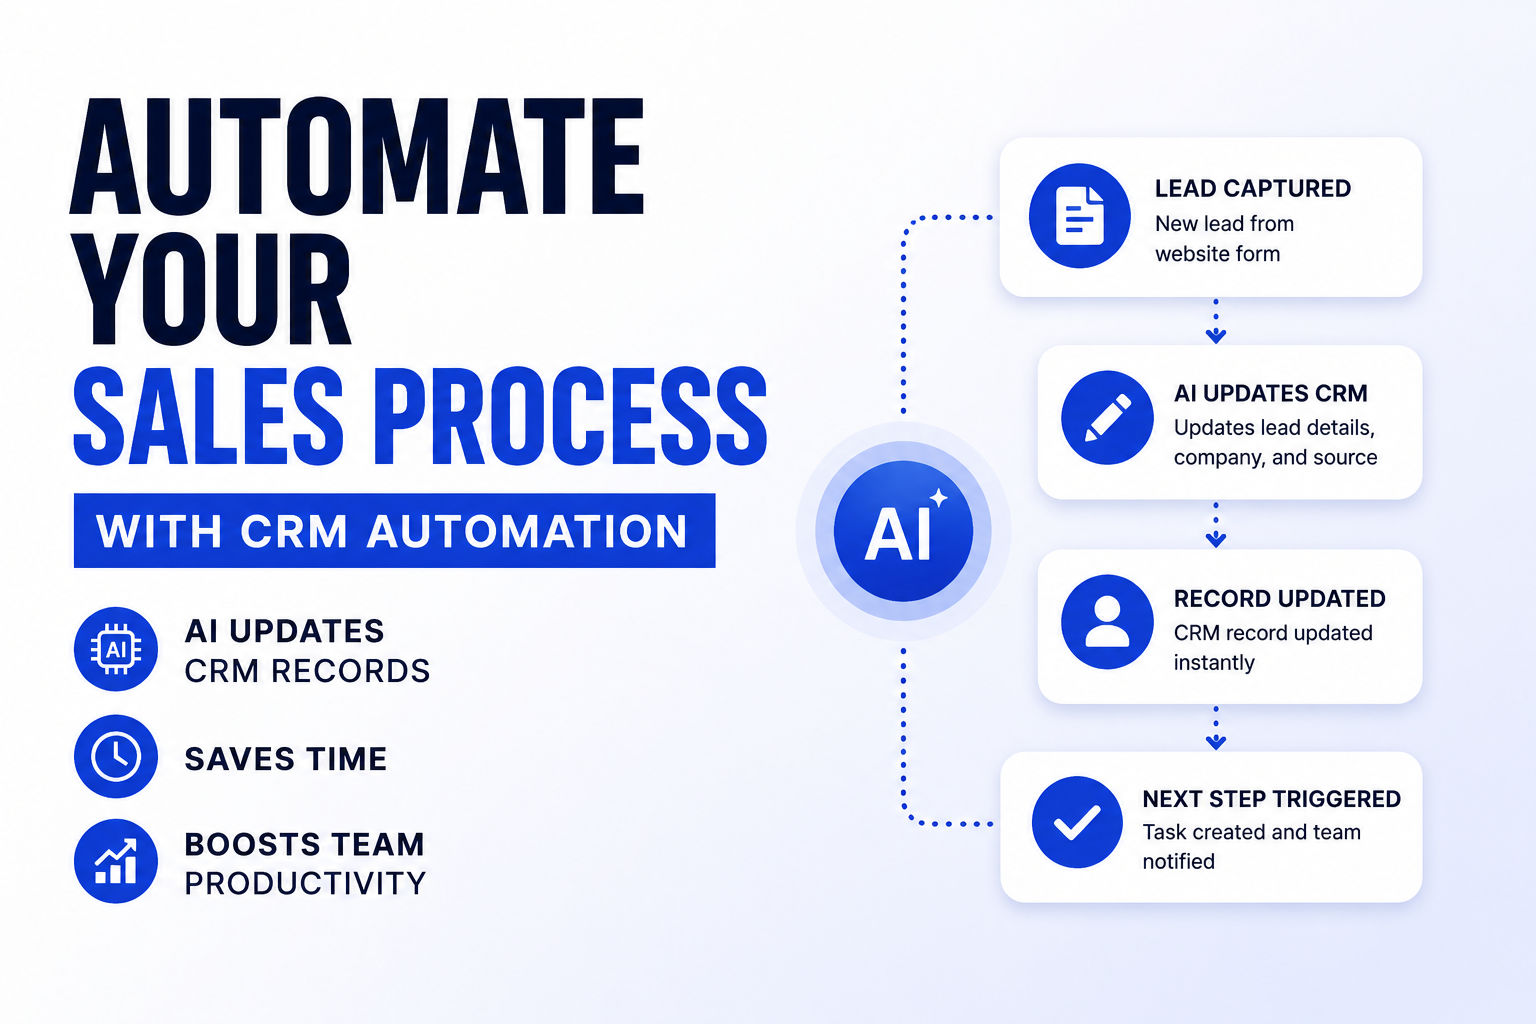
Building a solid weekly business report starts with getting your CRM right. Check out this guide on CRM automation for small business to make sure your data foundation is solid.
2. Problems with Manual Business Reporting
Let me tell you about the nightmare that is manual business reporting. I've lived it. I've hated it. And I suspect you have too.
The Time Drain Is Real
Here's a stat that blew my mind when I first heard it. The average team member spends about two hours per month on reports. Managers? They spend up to ten hours per month just reviewing and formatting.
That's insane. That's more than a full workday every month. For what? Copying numbers from one place to another?
I worked with a team once that was spending twelve hours a week on report assembly. Twelve hours! That's a whole person's worth of work, just compiling numbers that everyone already had access to.
The Hidden Costs Nobody Talks About
Beyond the time, there are other costs that aren't so obvious:
Spreadsheet Problems. You know the ones. You're working in Excel, and suddenly all your formulas break because someone deleted a row. Or you copy a formula and it references the wrong cells. Or you accidentally hit the wrong key and now everything is chaos. I've literally had to rebuild entire spreadsheets from scratch because I broke something and couldn't figure out how to fix it.
The Tool Treadmill. You're jumping between five different platforms, exporting data, trying to get everything in one place. It's exhausting. And every time you switch tools, you risk losing your place or making a mistake.
Stale Data. By the time you finish compiling everything, the numbers are already outdated. You're making decisions based on what happened last week, not what's happening right now. That's fine for trends, but not great for urgent decisions.
Formatting Chaos. Every week the report looks different. Different colors. Different fonts. Different layouts. Good luck trying to spot trends when everything keeps changing.
The Blame Game. When numbers are wrong, who's responsible? The person who exported the data? The person who copied it? The person who formatted it? Nobody wants to admit they made a mistake, so problems just get buried.
My Breaking Point
For me, the breaking point came when I realized I was spending more time on the report than I was on actually acting on the report. I'd spend three hours putting it together, and then I'd be so exhausted that I couldn't think clearly about what the numbers actually meant.
That's when I started looking for alternatives. And that's when I discovered automated reporting.
If you're making these productivity tool mistakes founders make, you're probably wasting even more time than you realize.
3. What Is Automated Reporting?
So what exactly is report automation? At its core, it's using software and AI to handle the grunt work of data collection and analysis.
But honestly? That description doesn't do it justice. It's more like having a really smart assistant who handles everything and never complains.
How This Actually Works
Let me break down what happens behind the scenes, step by step:
Step One: Connect Everything
You hook up your AI system to all your data sources. CRM, analytics, accounting software—everything that matters. The AI learns where your data lives and how to access it.
Step Two: Set a Schedule
You tell the system when to run. Maybe Monday at 8 AM. Maybe Friday at 5 PM. Whatever works for your workflow.
Step Three: Automation Kicks In
On schedule, the AI goes to work. It pulls fresh data from every source. It checks for errors and missing information. It calculates all your KPIs.
Step Four: Analysis Happens
Here's where it gets interesting. The AI doesn't just give you numbers. It actually thinks about what those numbers mean. It spots patterns you might miss. It identifies trends and anomalies.
Step Five: The Report Gets Built
The AI assembles everything into a polished report. Charts. Tables. Written analysis. The whole package.
Step Six: Delivery
The report shows up in your inbox or Slack. No fuss. No drama. Just the information you need, ready when you need it.
Why This Is Different
The key thing to understand is that this whole process runs with almost no human intervention. You set it up once, and then it just works. Week after week. Month after month.
You're not manually pulling data. You're not writing formulas. You're not formatting charts. The AI handles all of that.
You just show up, read the report, and make decisions.
It sounds almost too good to be true, right? But it works. I've been using it for a while now, and I honestly can't imagine going back to the old way.
If you're curious about the technology behind this, check out these open-source Zapier alternatives like n8n, ActivePieces, and Huginn that power many automated reporting workflows.
4. Business Apps You Can Connect to AI
One of the best things about this whole setup is how flexible it is. You can connect pretty much anything to your AI reporting system.
What You Can Connect
Honestly, the list is huge. But here are the big ones:
-
CRMs like Salesforce, HubSpot, or Pipedrive. All your sales data lives here.
-
Analytics like Google Analytics and Google Ads. Your website and marketing data.
-
Accounting like QuickBooks, Xero, or Stripe. Your financial data.
-
Marketing like your email platform and social media analytics.
-
Project Management like Asana, Jira, or Notion.
-
Customer Support like Zendesk or Freshdesk.
How This Works in Practice
Let me give you a concrete example from my own business.
I wanted a weekly report that showed revenue, pipeline, operational metrics, and support tickets. Here's what we set up:
- Revenue data from Stripe
- Pipeline data from Notion
- Operational metrics from Google Sheets
- Support ticket data from Zendesk
Everything gets pulled together into one clean dataset. The AI analyzes it, spots patterns, and generates a report. I get a complete picture of my business without ever touching a spreadsheet.
It took some time to set up initially. But now? It just works. Every Monday morning, I have everything I need.
Choosing the right CRM is crucial for this setup. Here's a comparison of open-source CRMs for small business to help you pick the right one.
5. How AI Automatically Creates Weekly Business Reports
Let me walk you through exactly how AI reporting works in practice. I'll share how my system runs so you can see what's actually happening.
The Seven Steps
1. It Starts Automatically
Every Monday at 9 AM, my system wakes up and starts working. I don't have to do anything. I don't even have to think about it.
2. Data Gets Pulled
My AI agents start pulling fresh numbers from every connected source. CRM. Analytics. Accounting. Everything gets updated.
3. Data Gets Checked
This is a step a lot of people skip, but it's crucial. The system checks for gaps, duplicates, and anomalies. If something looks weird, it flags it for my attention.
4. Everything Gets Combined
All the data from different sources gets normalized into one consistent format. Revenue from Stripe, leads from Salesforce, website traffic from GA4—it all fits together seamlessly.
5. KPIs Get Calculated
Now the fun part. The system calculates everything I care about. Week-over-week changes. Running totals. Averages. Whatever I need.
6. Analysis Happens
Here's where AI really shines. An AI model analyzes all the data and writes up what it means. It doesn't just tell me what changed. It explains why it matters.
7. Report Gets Delivered
Everything gets packaged into a polished report. Charts. Tables. Written analysis. The whole thing shows up in my email and Slack.
Why This Works
The beauty of this system is that it runs with almost no human intervention. I set it up once, and now it just works. Week after week. Month after month.
I'm not manually pulling data. I'm not writing formulas. I'm not formatting charts. The AI handles all of that.
I just show up, read the report, and make decisions.
What I've Learned
Honestly, the biggest surprise for me was how much better the AI-generated analysis is compared to what I was doing myself. The AI catches patterns I miss. It sees connections between different data sources that I wouldn't notice.
And the written summaries are actually good. Like, really good. The AI writes clearly and concisely, highlighting the key takeaways without burying me in details.
To really make this work, you need to understand CRM automation for small business and how it integrates with your reporting workflow.
6. Example of an AI-Generated Weekly Business Report
Let me show you what an actual AI-generated report looks like. This is from my own business, with the numbers changed to protect the innocent.
The Slack Version
Weekly Performance Snapshot Ad ROAS: 4.2x (+15.3% WoW) Ad Spend: $1,247.30 (+12.7% WoW) Total Sessions: 14.2k (+8.1% WoW) Top Channel: Organic Search (6,821 sessions) Net Revenue: $47,500 (+6.2% WoW) Strong performance driven by improved ad efficiency and organic growth.
text
That's it. Short, sweet, and immediately useful. I can read this in about ten seconds and know exactly how the week went.
The Detailed Version
If I want more detail, I can dig into the full report:
Subject: Weekly Performance Report - Excellent Growth Across Channels
Key Highlights:
- Net Revenue: $47,500 (+6.2% WoW)
- Top Channel: Organic Search — 6,821 sessions
- Ad ROAS: 4.2x (+15.3% WoW)
Google Ads Performance:
| Metric | Current Week | WoW Change |
|---|---|---|
| ROAS | 4.2x | +15.3% |
| Spend | $1,247.30 | +12.7% |
| Revenue | $5,238.66 | +30.2% |
| Clicks | 3,247 | +22.1% |
| Conversions | 142 | +27.9% |
Website Traffic:
| Metric | Current Week | WoW Change |
|---|---|---|
| Total Sessions | 14,200 | +8.1% |
| Top Channel | Organic Search (6,821) | +12.3% |
| Bounce Rate | 42.3% | -2.1% |
AI Analysis: This was a strong week across all channels. Ad spend increased by 12.7% while revenue jumped 30.2%, meaning your ROAS actually improved. Organic search continues to dominate traffic sources, accounting for nearly half of all sessions. The lower bounce rate suggests your content is resonating with visitors.
Recommendations:
- Consider increasing ad spend further given the positive ROAS trend
- Double down on organic content since it's driving quality traffic
- Review your top-performing ads to understand what's working
Why I Love This Format
Notice how the report is structured:
- Quick summary for when I'm in a hurry
- Detailed data for when I want to dig in
- AI analysis that explains what the numbers mean
- Actionable recommendations so I know what to do next
It's everything I need in one place. No hunting for information. No guesswork about what's important.
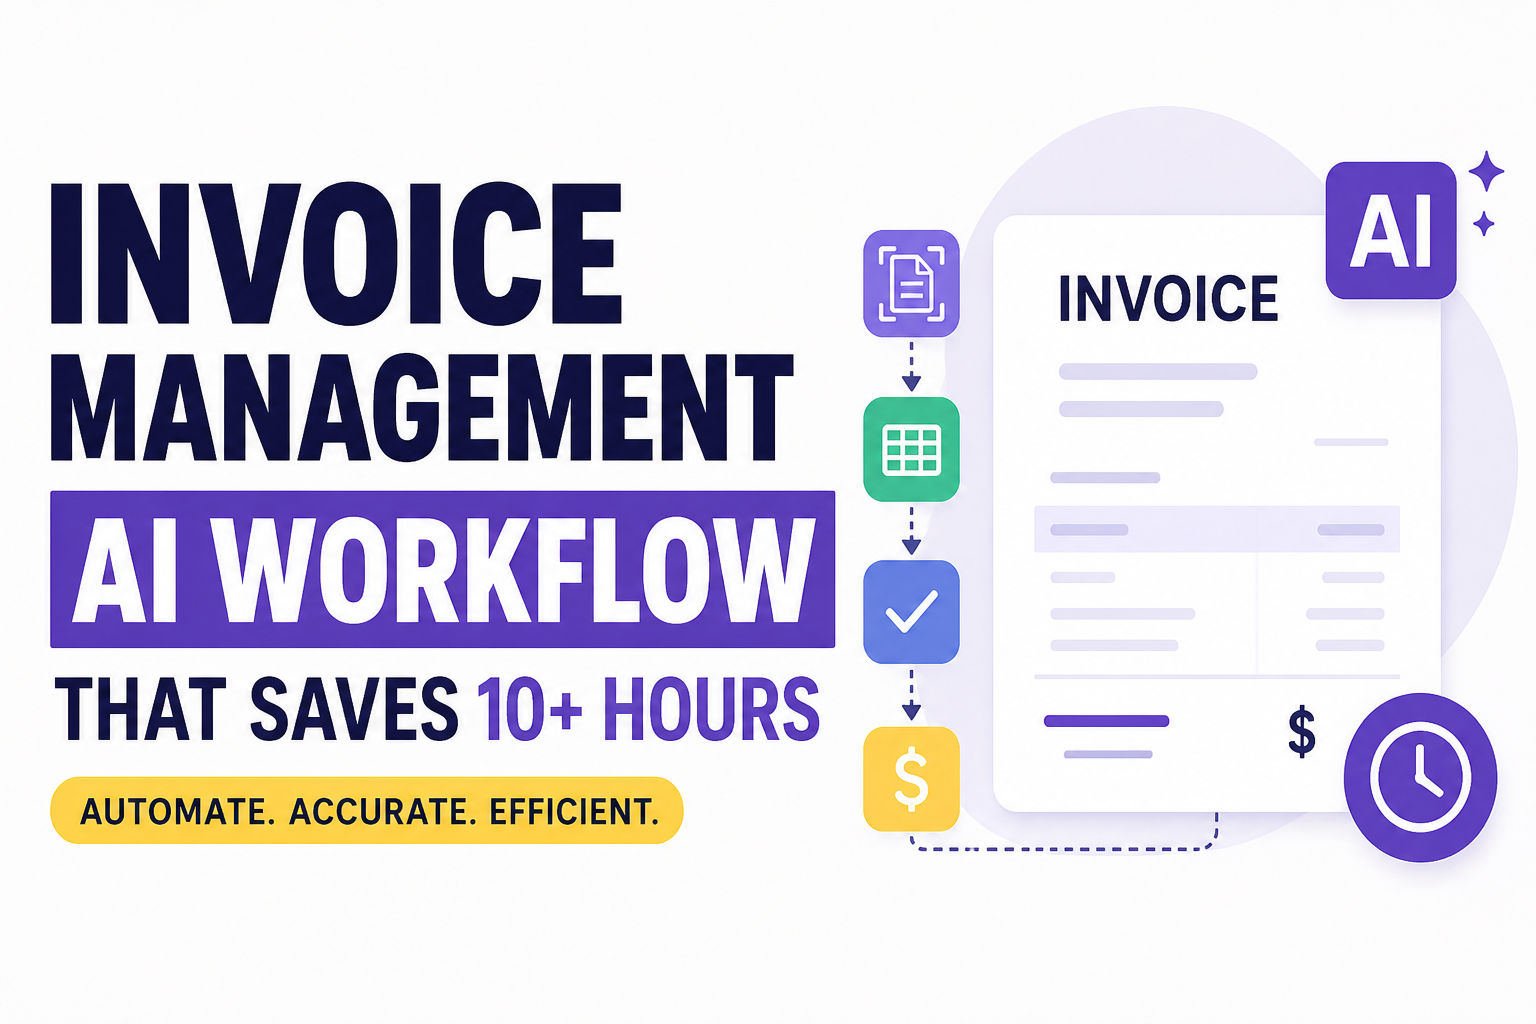
This invoice management AI workflow shows how similar automation principles apply to other areas of your business.
7. Benefits of AI Business Reporting
Alright, let's talk about why this actually matters. Why should you invest time and energy in business automation for your reporting?
The Honest Benefits
You Get Your Time Back
This is the obvious one, but it's worth saying again. Teams that automate their reporting reclaim 8-12 hours a week. That's time you can spend on customers, strategy, or just getting home at a decent hour.
For me personally, I reclaimed about six hours a week. That's three hundred hours a year. That's huge.
Fewer Embarrassing Mistakes
Remember those spreadsheet errors I mentioned earlier? They just stop happening. AI doesn't accidentally delete formulas or misplace decimal points. Your reports are consistently accurate.
I can't tell you how many times I've sent out reports with errors because of a spreadsheet mistake. It's mortifying. And it's completely avoidable with automation.
Faster Decisions
When you have fresh data on Monday morning, you can make decisions on Monday afternoon. Not Wednesday. Not Friday. Monday.
This has been huge for my business. I used to make decisions based on data that was a week old. Now I'm making decisions based on what happened yesterday.
Better Insights
Here's something I didn't expect. AI actually finds patterns humans miss. It'll notice that your best customers all come from a particular source, or that sales dip every time it rains.
I've found insights in my reports that I would never have spotted on my own.
Consistent Quality
Every report looks professional and polished. No more "well, Sarah was out sick so the formatting is weird this week" excuses.
Accountability
When everyone sees the same numbers on the same schedule, it's easier to hold people accountable. You reduce the "well, I didn't see that number" conversations.
Scalability
As your business grows, your reporting can grow too. Adding new data sources or metrics is easy once the automation is in place.
The Bottom Line
Look, automated reporting isn't going to change your life overnight. But it will make your life easier. It will save you time. It will reduce errors. And it will help you make better decisions.
That's worth investing in.
The same principles of invoice management AI workflow can be applied to your reporting systems for maximum efficiency.
8. Common Mistakes When Automating Reports
Now let's talk about where things can go wrong. I've seen a lot of people try automated reporting and mess it up. Learn from their mistakes.
Mistake 1: Garbage In, Garbage Out
This is the biggest one. AI insights are only as good as your source data. If your CRM has bad data, your reports will have bad data.
I learned this the hard way. I automated my reporting before cleaning up my data. The reports looked great, but the numbers were wrong. I had to go back and fix everything.
The fix: Validate your data sources first. Clean up your CRM. Fix those weird entries in your accounting system. Get your data house in order before you automate.
Mistake 2: Dashboard Bloat
I've seen dashboards with fifty metrics on them. Fifty! Nobody looks at all of those. They just become noise.
The fix: Keep it simple. Eight to fifteen KPIs max. Only track things that actually influence decisions.
Mistake 3: Trusting AI Too Much
AI hallucination is a real thing. Sometimes the AI just makes stuff up. It's not malicious. It just doesn't know better.
I once had an AI report claim that our revenue had doubled when it hadn't. It was a weird data anomaly that the AI misinterpreted.
The fix: Always review AI-generated reports before sending them out. The AI does the heavy lifting, but you're the quality control.
Mistake 4: Forgetting Context
Raw numbers mean nothing without context. Is a ten percent revenue increase good? Maybe, unless you spent twenty percent more to get it.
The fix: Make sure every metric includes context. Show the target. Show the previous period. Show how it compares to the goal.
Mistake 5: No Human Oversight
AI is powerful, but it's not a replacement for human judgment. You still need someone who understands the business to interpret the numbers.
The fix: Use AI as a tool, not a replacement. Let it handle the assembly and initial analysis. Keep humans in the loop for final review and decision-making.
Mistake 6: Overcomplicating Setup
Some people spend months trying to build the perfect automated reporting system. They never actually start because they're trying to make it perfect.
The fix: Start small. Automate one simple report. See how it goes. Expand from there.
Building production-ready AI agents takes careful planning to avoid these common pitfalls.
9. Build Your First AI Reporting Workflow
Ready to actually do this? Here's a practical roadmap. I've been through this process, so I know what works and what doesn't.
Step 1: Pick Your Tools
You've got options. Here's what I've used and what I think:
n8n - Open-source and powerful. This is what I use. It takes some setup, but it's incredibly flexible.
Make - Visual and user-friendly. Good if you're not technical.
Zapier - Simple and widely used. Works well for basic workflows.
Taskade Genesis - Newer but impressive. Builds the whole thing from a single prompt.
Pick whichever fits your comfort level and needs. There's no wrong answer here.
Step 2: Connect Your Data Sources
This is where the magic starts. Connect your tools to your data sources:
- CRM (Salesforce, HubSpot, Pipedrive)
- Analytics (Google Analytics, Google Ads)
- Accounting (Stripe, QuickBooks, Xero)
- Project management (Notion, Asana, Jira)
Step 3: Design Your AI Agent
Create an AI agent to analyze your data. I use:
- Claude Sonnet - Great for structured output
- OpenAI (GPT-4o) - Versatile and widely available
Set the temperature to zero for consistency. You want the same professional tone every week.
Step 4: Build Your Report Template
Decide how you want your report to look:
- Slack summary - Quick digest for the team
- Email report - Detailed HTML with tables
- PDF - For formal distribution
Customize the AI prompt to control the writing style and which metrics get highlighted.
Step 5: Schedule It
Set it and forget it:
- Monday at 9 AM for the week ahead
- First of the month for monthly reviews
- Daily if you need constant tracking
Step 6: Test Thoroughly
Don't just trust it works. Test everything:
- Run it manually first
- Check that all data pulls are correct
- Verify the AI analysis makes sense
- Look at the final report and ask: "Would I send this to my boss?"
Step 7: Add Error Handling
Things will break eventually. Plan for it:
- Add notifications for failed runs
- Set up alerts when data is missing
- Have a backup process for when things go wrong
My First Workflow
Here's what I started with:
- Trigger every Monday morning
- Pull revenue from Stripe
- Fetch pipeline data from Notion
- Get operational metrics from Google Sheets
- Have Claude analyze everything
- Send a Slack summary
- Email a detailed report
It took me about a day to set up. And honestly, it changed how I work.
For the technical setup, these open-source Zapier alternatives like n8n, ActivePieces, and Huginn are worth exploring.
Conclusion – Start Automating Your Weekly Reports Today
Look, I'm not going to pretend this is the easiest thing you'll ever do. Setting up automated reporting takes some initial work. You'll need to connect your tools, configure your AI, and test everything to make sure it works.
But here's the thing about that initial investment. It pays off. Big time.
Once your system is running, it just works. Week after week. Month after month. You stop wasting Monday mornings on spreadsheets. You stop worrying about formula errors. You stop wondering what the numbers mean because the AI tells you.
I've been using automated reporting for over a year now. I honestly can't imagine going back. The time savings alone are worth it. But it's more than that. It's the peace of mind that comes from knowing your data is accurate and up to date. It's the confidence that comes from making decisions based on solid information.
Start small. Pick one report. Automate it. See how it feels. Then expand from there.
Your Monday mornings will thank you.
And remember, if you're looking to take your automation further, CRM automation for small business is a great next step after you've got your reporting sorted.
This guide on automated reporting was written based on real-world experience implementing AI reporting systems for small and medium businesses. The specific tools mentioned (n8n, Make, Zapier, etc.) are widely used in the automation space, but always evaluate what works best for your specific needs.
CS student and builder writing about tech, startups, AI, and productivity. Built a SaaS that didn't ship — walked away with real product experience instead. Sharing everything learned along the way.